Why the Comparison Group Matters in Growth Hormone Research
If one group grows 8 cm over a year and another grows 7 cm, the difference between their averages is 1 cm. Calling the entire 8 cm a treatment effect ignores what happened under the alternative condition. A comparison is only interpretable when the outcome, timing and study design remain visible.
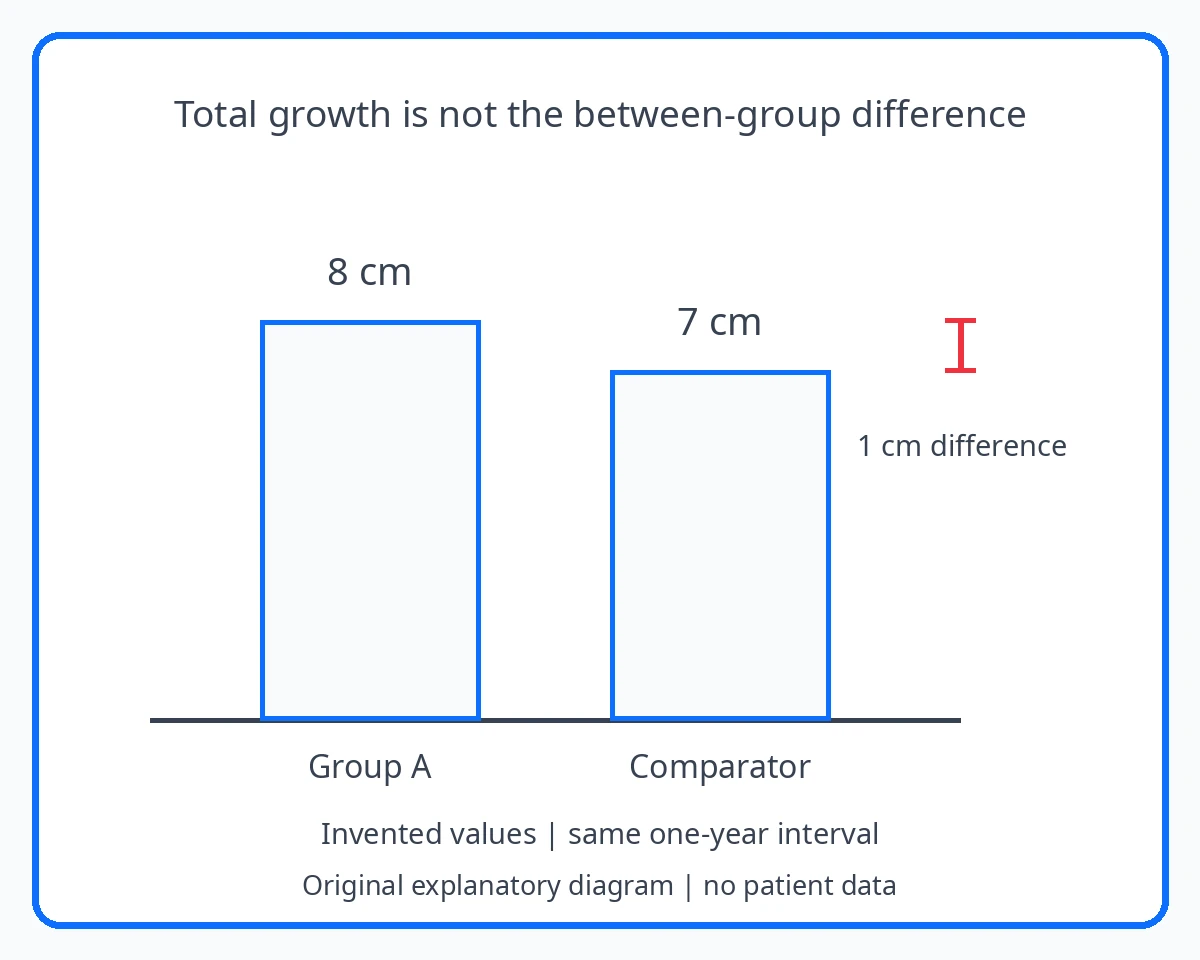
Compare the same quantity over the same interval
The fictional 8 cm and 7 cm values are group-average changes over the same one-year period. Subtracting the comparator change gives a 1 cm between-group difference. This arithmetic is not a result for a medicine. It illustrates why the total change in one group and the difference between conditions are distinct quantities.
Cochrane’s guidance on effect measures emphasizes identifying the quantity being compared. Check whether a paper reports final values, changes from baseline or an adjusted estimate. A simple subtraction of published averages may not reproduce the paper’s prespecified analysis. Preserve the reported method rather than replacing it with whichever calculation makes the larger headline. [2]
Keep absolute and relative effect descriptions separate using Absolute and Relative Changes in Growth Research
Read the design beyond the word “controlled”
Randomization, allocation concealment and blinding address different parts of a study. Randomization concerns assignment to groups; concealment protects the allocation process from foreknowledge; blinding concerns who knows the assigned intervention. Cochrane’s bias guidance treats study conduct as something to examine, not a label that automatically settles credibility.
A comparator called “usual care” also needs a description. Look for what each group actually received, whether outcomes were assessed at the same time and which participants lacked measurements. If the methods are unclear, retain that gap. Knowing that a comparison group exists does not establish that every other relevant difference has been controlled. [1]
Total change and the between-group difference
The numerical example is fictional and explains how to read an outcome. It is not a result for a medicine or an expected result for a child.
| Item to compare | Example or information | What it means |
|---|---|---|
| Group A | Average height change: 8 cm over one year | Observed change under condition A |
| Comparator | Average height change: 7 cm over the same year | Observed change under the alternative condition |
| Arithmetic contrast | 8 minus 7 = 1 cm | Difference between these fictional averages |
| Design question | How were groups assigned and followed? | Needed before a causal interpretation |
| Precision question | How uncertain is the estimated difference? | Not answered by the two averages alone |
What disappears when the comparator is omitted
A fictional advertisement highlights “8 cm of growth” and leaves out the 7 cm comparator result. Restoring the comparator changes the question from total growth to the difference between conditions. The 1 cm contrast is smaller, but its importance still cannot be judged from magnitude alone.
The reader also needs the participants, study design, uncertainty and endpoint definition. A group average does not mean every participant changed by that amount, and a correct subtraction does not make an observational comparison randomized. Keep the arithmetic and the strength of the inference separate. The distinction between a measured marker and a demonstrated health benefit is useful when a claim goes beyond the endpoint actually measured.
Use missing data as a question, not an afterthought
Find the number assigned to each condition and the number contributing to the outcome analysis. Look for reasons measurements are missing and how the analysis handled them. If participants who leave differ from those retained, a result based only on available measurements may require additional assumptions.
A useful reading note describes the comparison and the main unresolved design issue in plain language. It does not assign a homemade quality score or declare that every randomized study is reliable. The goal is to understand which alternative the study actually compared and how strongly its evidence supports the conclusion. [1]
When allocation was not randomized, examine What an Observational Growth Study Can and Cannot Establish
Fictional group averages are not clinical expectations
The numbers are illustrative and are not clinical expectations. No treatment selection follows from this example.
Sources and reading context
- Cochrane Handbook chapter 7 bias and conflicts — Assess risk of bias and disclosures without automatic truth judgments
- Cochrane Handbook chapter 6: effect measures — Effect measurement and comparable outcomes; original arithmetic examples, no treatment estimates invented