Height Standard Deviation Scores in Research: A Reader's Guide
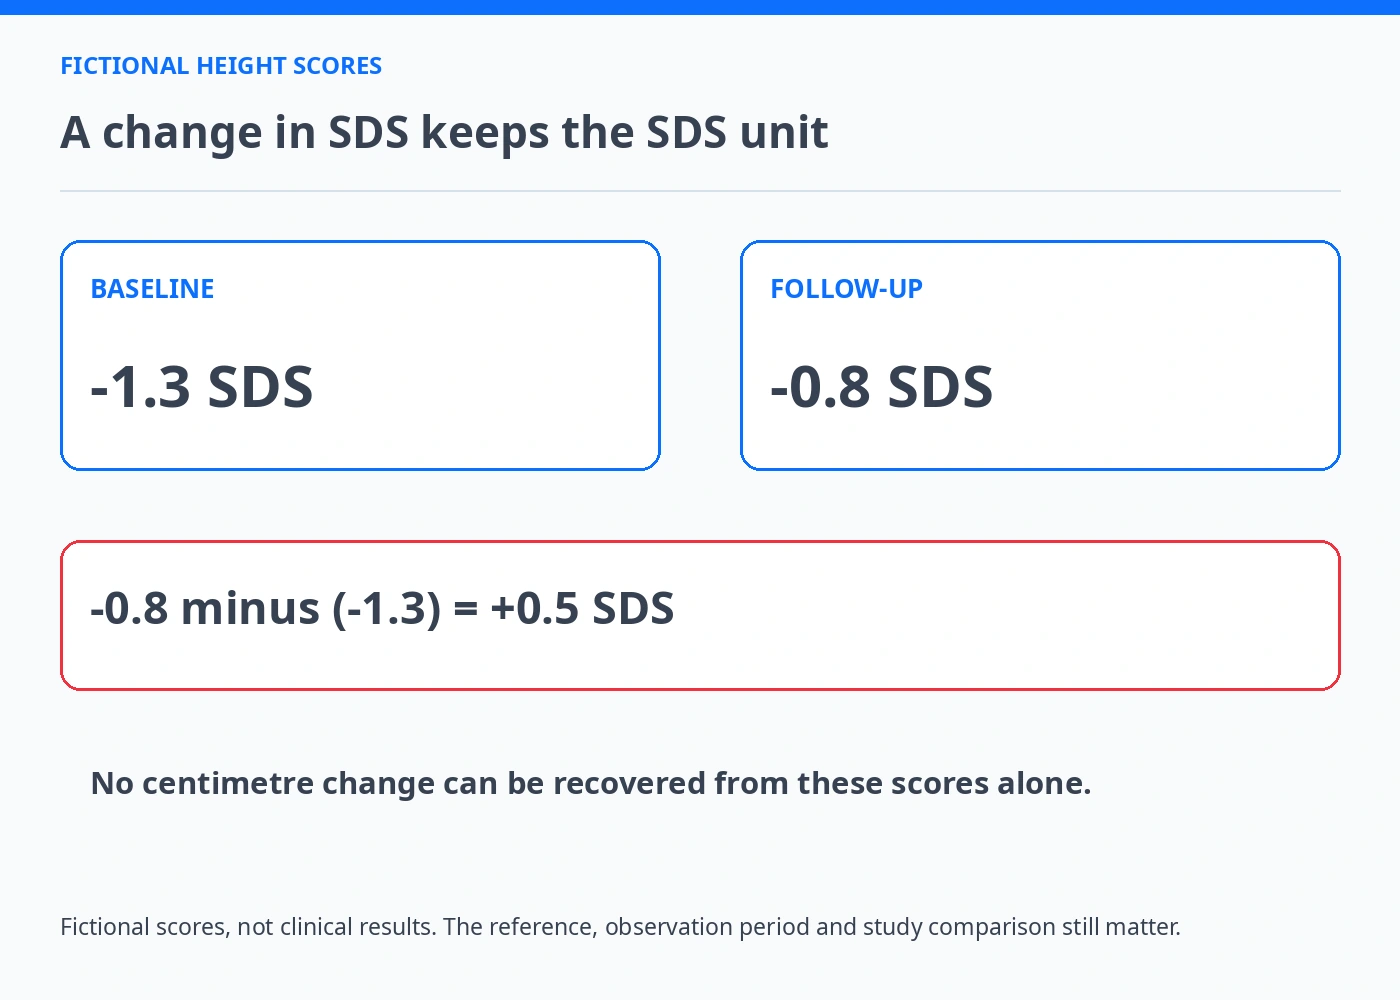
A change from -1.3 to -0.8 height SDS is a change of 0.5 SDS, not half a centimetre. Height standard deviation score describes a position relative to a reference distribution. Understanding the unit is the first step; the next is finding which reference and which observations produced it.
Read the score together with its reference
CDC publishes age- and sex-specific LMS parameters for its growth-chart distributions. The method allows for distribution shape; it is not simply one fixed mean and standard deviation for all childhood ages. If a study reports height SDS, locate its reference and the categories used to calculate the score before comparing it with another paper.
A reference score and a raw height answer different questions. Raw height records the measured length in units such as centimetres. SDS places that measurement in a particular distribution. Two papers using the same abbreviation may still require a reference check. An unlabeled score is not enough to reconstruct the original measurement or its clinical meaning. [1]
For differences between growth-chart references, read Why Growth Charts May Show Different Percentiles
Calculate the change without changing the unit
In the fictional example, subtracting -1.3 from -0.8 gives +0.5 SDS. The minus sign indicates a position on the reference scale; it is not a negative physical height. Moving towards zero means moving towards the reference centre on that scale, but it does not reveal the centimetres gained during the interval.
The KIGS report uses Swiss references for height SDS, with Japanese references for the Japanese results in comparisons between geographical regions. Keep that analysis-specific distinction visible. CDC’s data here explain reference-based scoring; they are not a substitute for either reference in the paper. Recalculating a result with a familiar chart would be a different analysis, not a clarification of the published score. [2]
A half-unit change on the SDS scale
The numerical example is fictional and explains how to read an outcome. It is not a result for a medicine or an expected result for a child.
| Item to compare | Example or information | What it means |
|---|---|---|
| Baseline | -1.3 SDS | A reference-based score, not centimetres |
| Follow-up | -0.8 SDS | Keep the follow-up time and reference identifiable |
| Difference | -0.8 minus (-1.3) = +0.5 SDS | The subtraction preserves the SDS unit |
| Raw height | Not supplied in this arithmetic example | No centimetre difference can be recovered here |
| Treatment interpretation | No comparator or design supplied | The change alone is not a treatment-effect estimate |
Why “half a centimetre” is the wrong translation
A fictional headline calls the +0.5 SDS change “half a centimetre.” It has not merely rounded the result; it has replaced one quantity with another. The appropriate correction is to retain +0.5 SDS and describe the reference and observation period, then look separately for any raw-height result.
Even the correctly labelled change needs context. Without a comparator and a study design, it does not say how much change was caused by treatment. Without later follow-up, it does not establish adult height. Correct arithmetic is the start of interpretation, not its completion.
For other changes that can be misread when units are dropped, see Absolute and Relative Changes in Growth Research
Ask what the endpoint contributes to the study question
Use a reading note with the population, reference, baseline and follow-up times, analysis group and comparator. If a detail is missing from the abstract, look in the methods or supporting material. Do not fill it with a reference from another study because the topic and score name look similar.
A summary can say what changed on the reported scale while leaving unresolved questions visible. For an individual child, a research SDS result is not a diagnosis or a personal height prediction. The clinical team needs the child’s own measurements and history, rather than a conversion invented from a published score.
A reference score is not an individual height forecast
This guide supplies no individual height prediction, diagnostic threshold or treatment recommendation. The illustrative scores are invented for explaining units.
Sources and reading context
- CDC growth-chart data files — Reference-dependent LMS and z-score concepts
- KIGS pediatric growth-hormone registry analysis — Methods pages 3-4; limitations14, funding15. Distinct cohorts and observational limitations; no causal safety proof