Absolute and Relative Changes in Growth Research
A change from 6 to 7.2 cm per year is an increase of 1.2 cm per year, or 20% relative to the starting rate. Those statements describe the same fictional arithmetic. Neither means that adult height increased by 20%, and neither by itself establishes a treatment effect.
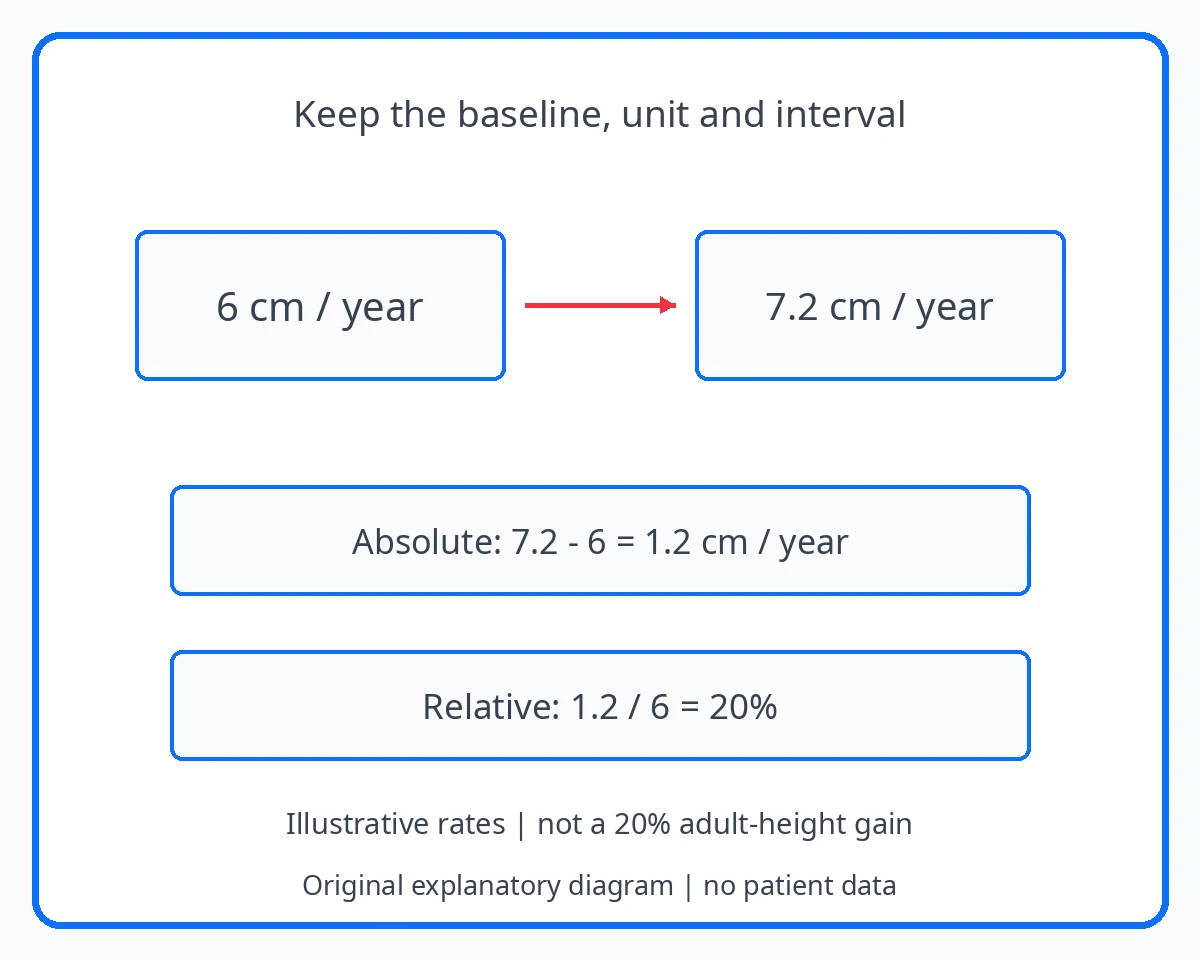
Keep the starting value beside the percentage
The absolute difference is 7.2 minus 6, giving 1.2 cm per year. Dividing that difference by the starting 6 gives 0.2, or 20%. The denominator is doing important work: a percentage without its starting value can make the size of a change difficult to understand. Keep the original outcome and unit visible.
Cochrane distinguishes effect measures according to the kind of outcome and comparison. A before-and-after percentage and a between-group treatment contrast are not automatically the same thing. If a paper reports an adjusted comparison, preserve that definition instead of presenting a simple change within one group as the estimated treatment effect. [1]
Separate percentages from percentage points and scores
For a fictional proportion changing from 10% to 12%, the absolute difference is 2 percentage points. The relative increase is 2 divided by 10, or 20%. Saying “up 2%” leaves the reader unsure which quantity is intended. Give the starting and ending proportions when space allows, then label the calculation.
Height percentiles and SDS are reference-based measures, not percentages of a child’s physical height. CDC’s growth-chart data illustrate that their interpretation depends on the reference distribution. A percentile change cannot be turned into a percentage height gain merely because the numbers share a percent-like label. Read the name of the outcome as carefully as the digits. [2] [1]
Two examples with the same relative percentage
All values are fictional arithmetic illustrations. They do not supply expected growth, clinical thresholds or real treatment effects.
| Part of the question | What to retain | Why it matters |
|---|---|---|
| Rate example | 6 to 7.2 cm/year | Absolute increase: 1.2 cm/year |
| Rate denominator | 1.2 / 6 = 0.20 | Relative increase: 20% from the starting rate |
| Proportion example | 10% to 12% | Absolute increase: 2 percentage points |
| Proportion denominator | 2 / 10 = 0.20 | Relative increase: 20% from the starting proportion |
| Meaning | Outcomes and original scales differ | The shared 20% does not make the results equivalent |
Replace a large-looking percentage with an understandable comparison
“Growth improved 20%” leaves out the measured quantity. For the fictional rate example, “the rate changed from 6 to 7.2 cm per year” gives the reader the original scale. Adding “an increase of 1.2 cm per year” makes the arithmetic explicit without implying a change in adult height.
The wording still needs the study interval, comparator and uncertainty if it is used to describe research. A precise percentage does not establish that a change matters clinically, and the two invented examples cannot tell a reader what result to expect from treatment.
For the separate meaning of SDS units, see Height Standard Deviation Scores in Research: A Reader's Guide
Report uncertainty without letting it disappear behind the calculation
Find the interval estimate, sample size and time point in the actual paper. The arithmetic between two displayed averages can be correct while the underlying estimate remains uncertain. A small starting value can also make a relative change look striking, so show the absolute quantity when it helps the reader judge scale.
Do not compare two percentages as though they answer the same question until their outcomes and denominators match. A rate, a proportion and a reference score each carry different meaning. Clear reporting keeps that meaning intact and leaves clinical importance to evidence about the relevant outcome, rather than the visual size of a percentage.
For percentages used to describe benefit and harm, read Questions That Clarify Risk and Benefit in Longevity Marketing
Arithmetic examples do not set a clinical target
All numerical examples are invented. No expected growth rate, clinical target or treatment effect is supplied.
Sources and reading context
- Cochrane Handbook chapter 6: effect measures — Effect measurement and comparable outcomes; original arithmetic examples, no treatment estimates invented
- CDC growth-chart data files — Reference-dependent LMS and z-score concepts