What Treatment Registries Add to Clinical Trial Evidence
A registry paper may contain tens of thousands of records while a particular later outcome comes from a much smaller group. The useful question is not just “How big is the database?” but “Who contributed to this result?” KIGS provides a concrete example of why each analysis needs its own denominator.
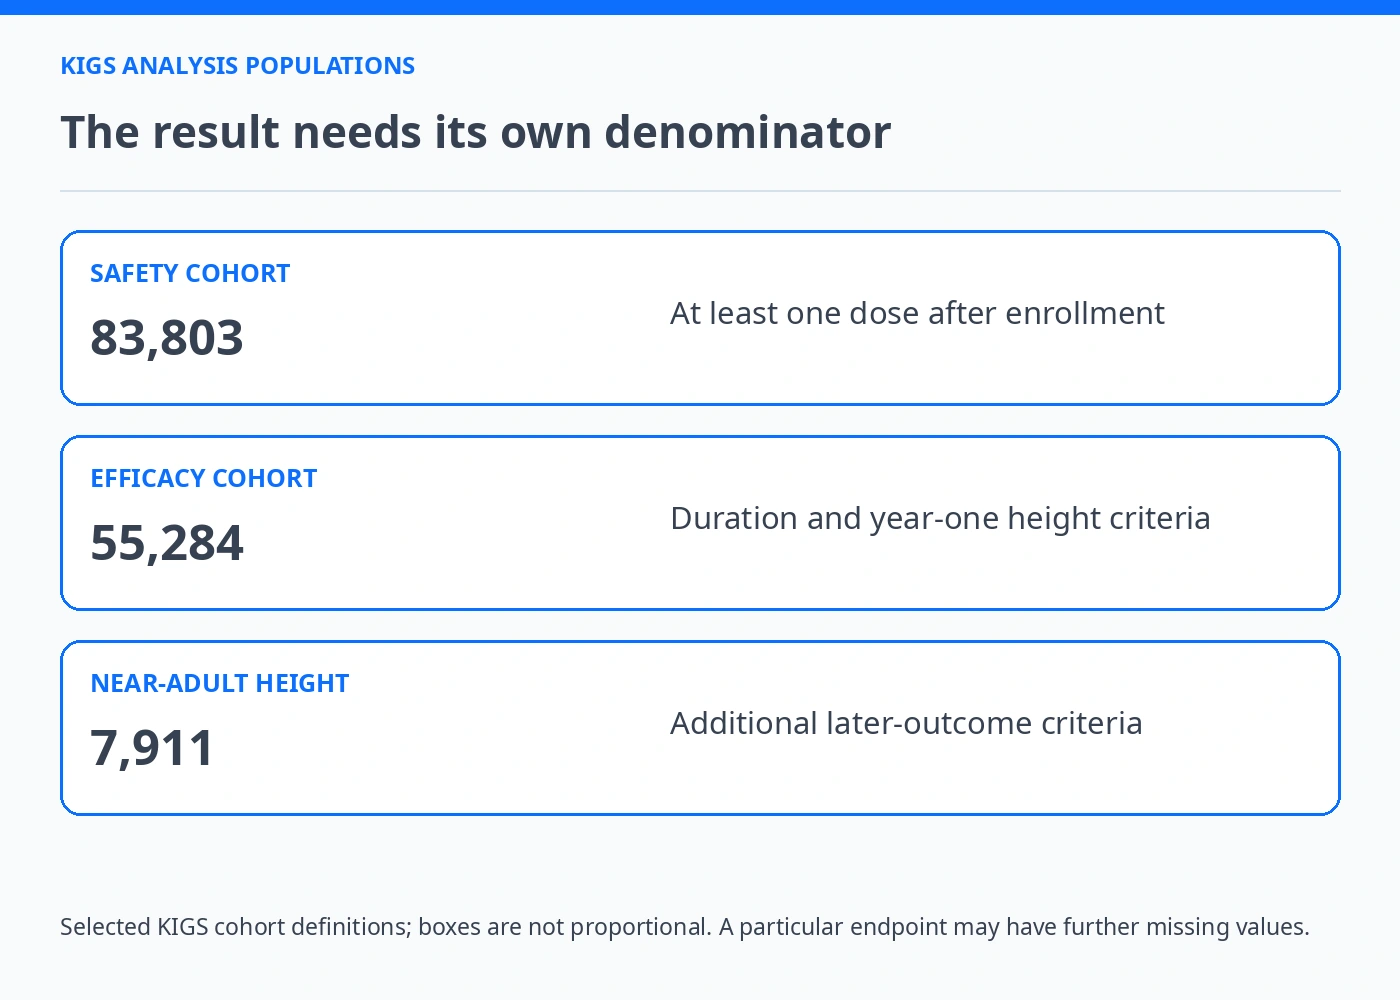
Find the group behind the endpoint
The KIGS report identifies 83,803 participants in its safety cohort, 55,284 in its efficacy cohort and 7,911 in the near-adult-height subgroup. These are analysis populations, not three interchangeable ways to describe the sample size. The year-one efficacy group required sufficient treatment duration and a year-one height assessment; the later-height group had additional eligibility requirements.
Use the flow diagram and methods together. A record may qualify for one analysis while lacking the follow-up required for another. Even within an analysis group, a specific variable can have missing values. Copy the denominator attached to the actual result, rather than selecting the largest count visible in the abstract or title. [1]
Understand what routine-care observation can contribute
Registries can describe clinical populations and patterns across settings that differ from a tightly controlled trial. They can also identify events and questions needing further investigation. In KIGS, reported relationships between adverse events and treatment were investigator judgments without central adjudication. An event after treatment and a demonstrated causal effect are therefore different claims.
Read how information was collected and what the authors say may be missing. A blank event field should not automatically be interpreted as proof that nothing happened. The database’s value depends on its collection process as well as its size, and a reassuring descriptive result does not supply an individual risk prediction for every reader. [1]
Three KIGS analysis populations
These counts come from the cited KIGS report, not a fictional dataset. The table gives selected eligibility features; consult its methods for the complete definitions.
| Part of the evidence | What is recorded | How to read it |
|---|---|---|
| Safety cohort | 83,803 participants | Received at least one dose after enrollment |
| Efficacy cohort | 55,284 participants | Required treatment duration and year-one height assessment |
| Near-adult-height subgroup | 7,911 participants | Additional later-height and follow-up criteria applied |
| A specific endpoint | Check its own available-data count | A cohort total may still exceed that endpoint’s denominator |
| Causal interpretation | Observational records with collection limitations | A large count is not random allocation |
Do not lend the largest count to a smaller endpoint
A summary could place “83,803 participants” beside a near-adult-height result and leave the impression that all those participants supplied that outcome. The report’s distinct analysis populations show why that is misleading. The later-height subgroup has its own count and selection criteria.
The correction is to identify the population actually analyzed, then check the denominator for the particular result being quoted. This does not make the larger safety dataset irrelevant. It keeps each part of the evidence attached to the question it can address.
For why an individual safety report also does not establish cause, read Reporting a Suspected Medicine Side Effect: Building a Clear Timeline
Keep database size separate from causal certainty
Cochrane’s guidance on non-randomized studies explains why confounding, selection and missing data still need attention. Increasing the number of records does not automatically remove systematic differences in treatment choice or follow-up. A precisely estimated association can remain dependent on assumptions about those differences.
Read registry findings alongside trial evidence by asking how their questions and populations differ. Avoid both extremes: dismissing routine-care data because they are observational, or treating a large database as proof that a treatment is universally safe or effective. A useful summary describes the contribution and the unresolved inference together. [2]
For confounding in non-randomized records, see What an Observational Growth Study Can and Cannot Establish
Registry counts are not individual risk estimates
No registry count is used here as an individual risk estimate or proof that a product is safe for everyone. This article does not independently validate the KIGS dataset.
Sources and reading context
- KIGS pediatric growth-hormone registry analysis — Methods pages 3-4; limitations14, funding15. Distinct cohorts and observational limitations; no causal safety proof
- Cochrane Handbook chapter 24: non-randomized studies — Confounding and non-randomized study interpretation