What an Observational Growth Study Can and Cannot Establish
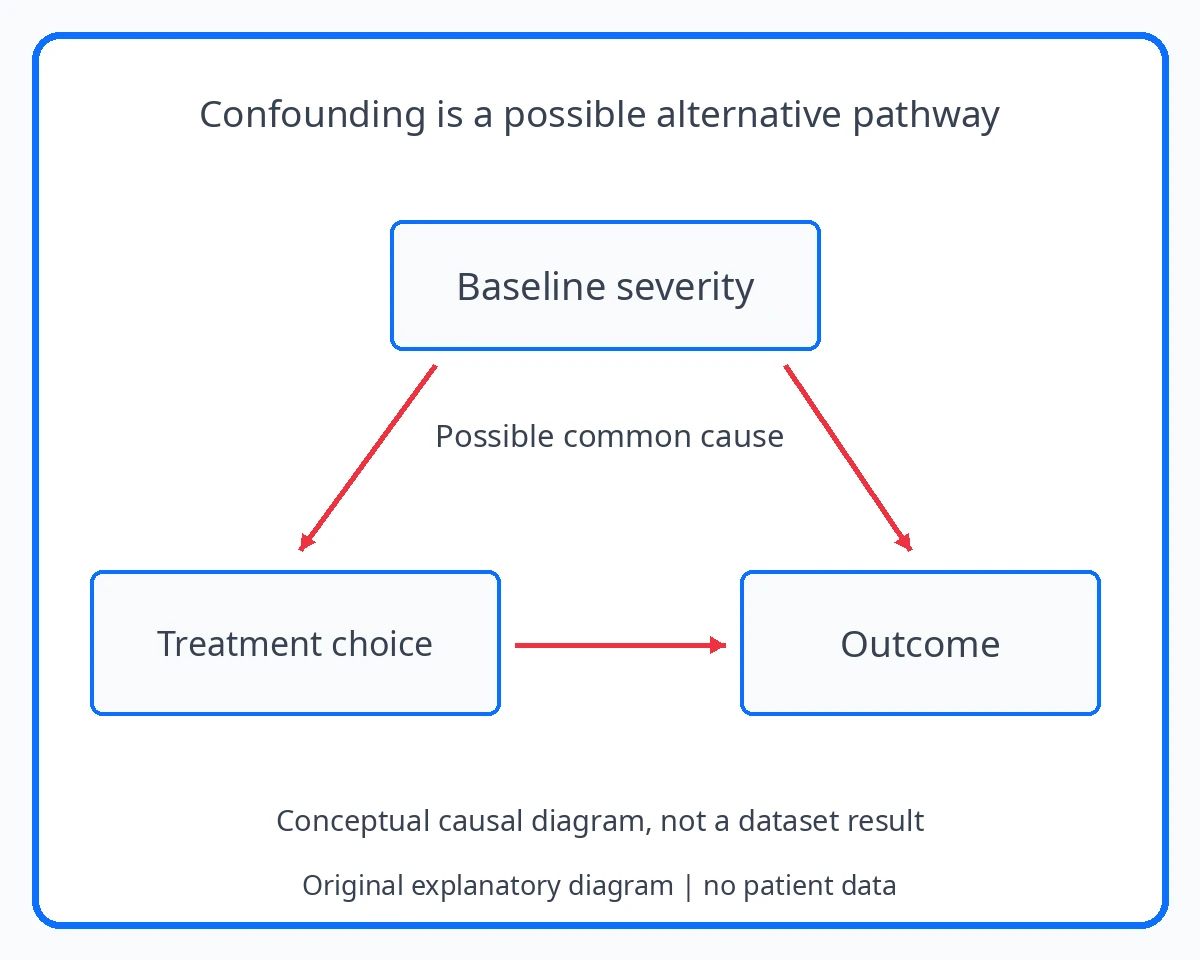
If more severe cases are more likely to receive treatment, severity may also influence their later outcomes. A simple treated-versus-untreated comparison can then mix the treatment question with a pre-existing group difference. That is a confounding concern to examine, not proof that an observational study is worthless or that its association is causal.
Look for a factor that influences both pathways
Cochrane’s non-randomized-study guidance describes confounding as a central issue when treatment is not randomly allocated. In the conceptual example here, baseline severity affects both treatment choice and the later outcome. The diagram therefore has two arrows leaving severity, alongside a separate possible pathway from treatment to outcome.
The example does not establish that severity confounded a named dataset. It shows what information a reader needs: how treatment decisions were made, which baseline factors were measured and whether those factors also relate to the outcome. A diagram is useful when it exposes an assumption; it cannot supply measurements that the study never collected. [1]
For design features of a comparison group, read Why the Comparison Group Matters in Growth Hormone Research
Read what adjustment actually included
Find the variables in the model, their timing and how they were measured. An analysis can address specified measured factors under assumptions, but the word “adjusted” does not mean every relevant difference has disappeared. An imprecisely measured factor or an important unrecorded factor can remain a concern even in a complex model.
Registry evidence such as KIGS can describe outcomes in routine care while still requiring attention to selection and available records. Read the analysis group and limitations alongside the estimate. Do not treat the number of variables in a model as a credibility score, or assume a large database has randomized the people within it. [1] [2]
A fictional severity-related selection problem
This conceptual example describes possible pathways. It contains no treatment-effect estimate and is not a reanalysis of KIGS.
| Part of the question | What to retain | Why it matters |
|---|---|---|
| Before treatment | More severe cases are more likely to receive treatment | Allocation differs between baseline groups |
| Outcome pathway | Severity may also affect the later outcome | Treatment and outcome share a possible common cause |
| Recorded factor | Severity is measured, but the method needs checking | A label alone does not establish measurement quality |
| Adjustment | The analysis includes the recorded severity measure | Check model assumptions and other relevant factors |
| Conclusion | An association remains to be interpreted | No direction or size of confounding is calculated here |
A worse outcome in treated cases does not settle the cause
In the fictional setting, treated cases began with greater severity. If their later average outcome is worse, the comparison cannot simply assign that difference to treatment. Nor should a better average automatically be credited to treatment. The starting differences and the analysis both matter.
The useful response is to inspect the methods rather than reverse the conclusion by instinct. Ask what was measured before treatment, how comparable the groups were and what assumptions support the adjusted estimate. A possible alternative explanation is a reason for careful reading, not an estimate of how much the result must be wrong.
For the distinct value and limits of registry data, see What Treatment Registries Add to Clinical Trial Evidence
Choose language that matches the analysis
“Associated with” and “caused by” make different claims. A careful summary can describe the observed relationship and the authors’ analytical approach while naming important remaining uncertainty. If the paper attempts a causal analysis, read the assumptions rather than rejecting or accepting it solely because the data are observational.
Routine-care records can identify patterns, describe populations and raise questions beyond a trial’s setting. Their value is not erased by limitations. The reader’s task is to keep those contributions separate from claims the design cannot support, including a personal prediction or a treatment decision based on an isolated group comparison. [1] Also check whether the participants and intervention match the claim before applying a result to a different group.
A possible pathway is not proof of confounding in a dataset
This guide does not reanalyze a study or prove that any particular association is confounded. It explains questions to ask when reading the methods.
Sources and reading context
- Cochrane Handbook chapter 24: non-randomized studies — Confounding and non-randomized study interpretation
- KIGS pediatric growth-hormone registry analysis — Methods pages 3-4; limitations14, funding15. Distinct cohorts and observational limitations; no causal safety proof